# install
devtools::install_github("ikashnitsky/sjrdata")

# load
library(sjrdata)

# use
View(sjr_countries)
SCImago Journal & Country Rank provides valuable estimates of academic journals’ prestige. The data is freely available at the project website and is distributed for deeper analysis in forms of .csv and .xlsx files. I downloaded all the files and pooled them together, ready to be used in R.
Basically, all the package gives you three easily accessible data frames: sjr_journals (Journal Rank), sjr_countries (Country Rank, year-by-year), and sjr_countries_1996_2017 (Country Rank, all years together).
The whole process of data acquisition can be found in the github repo (dev directory) or this gist.
How to use sjrdata
Install the package from github, load it and use the data.
The installation will take a while since the main dataset sjr_journals is pretty heavy (15.7MB compressed).
A couple of examples
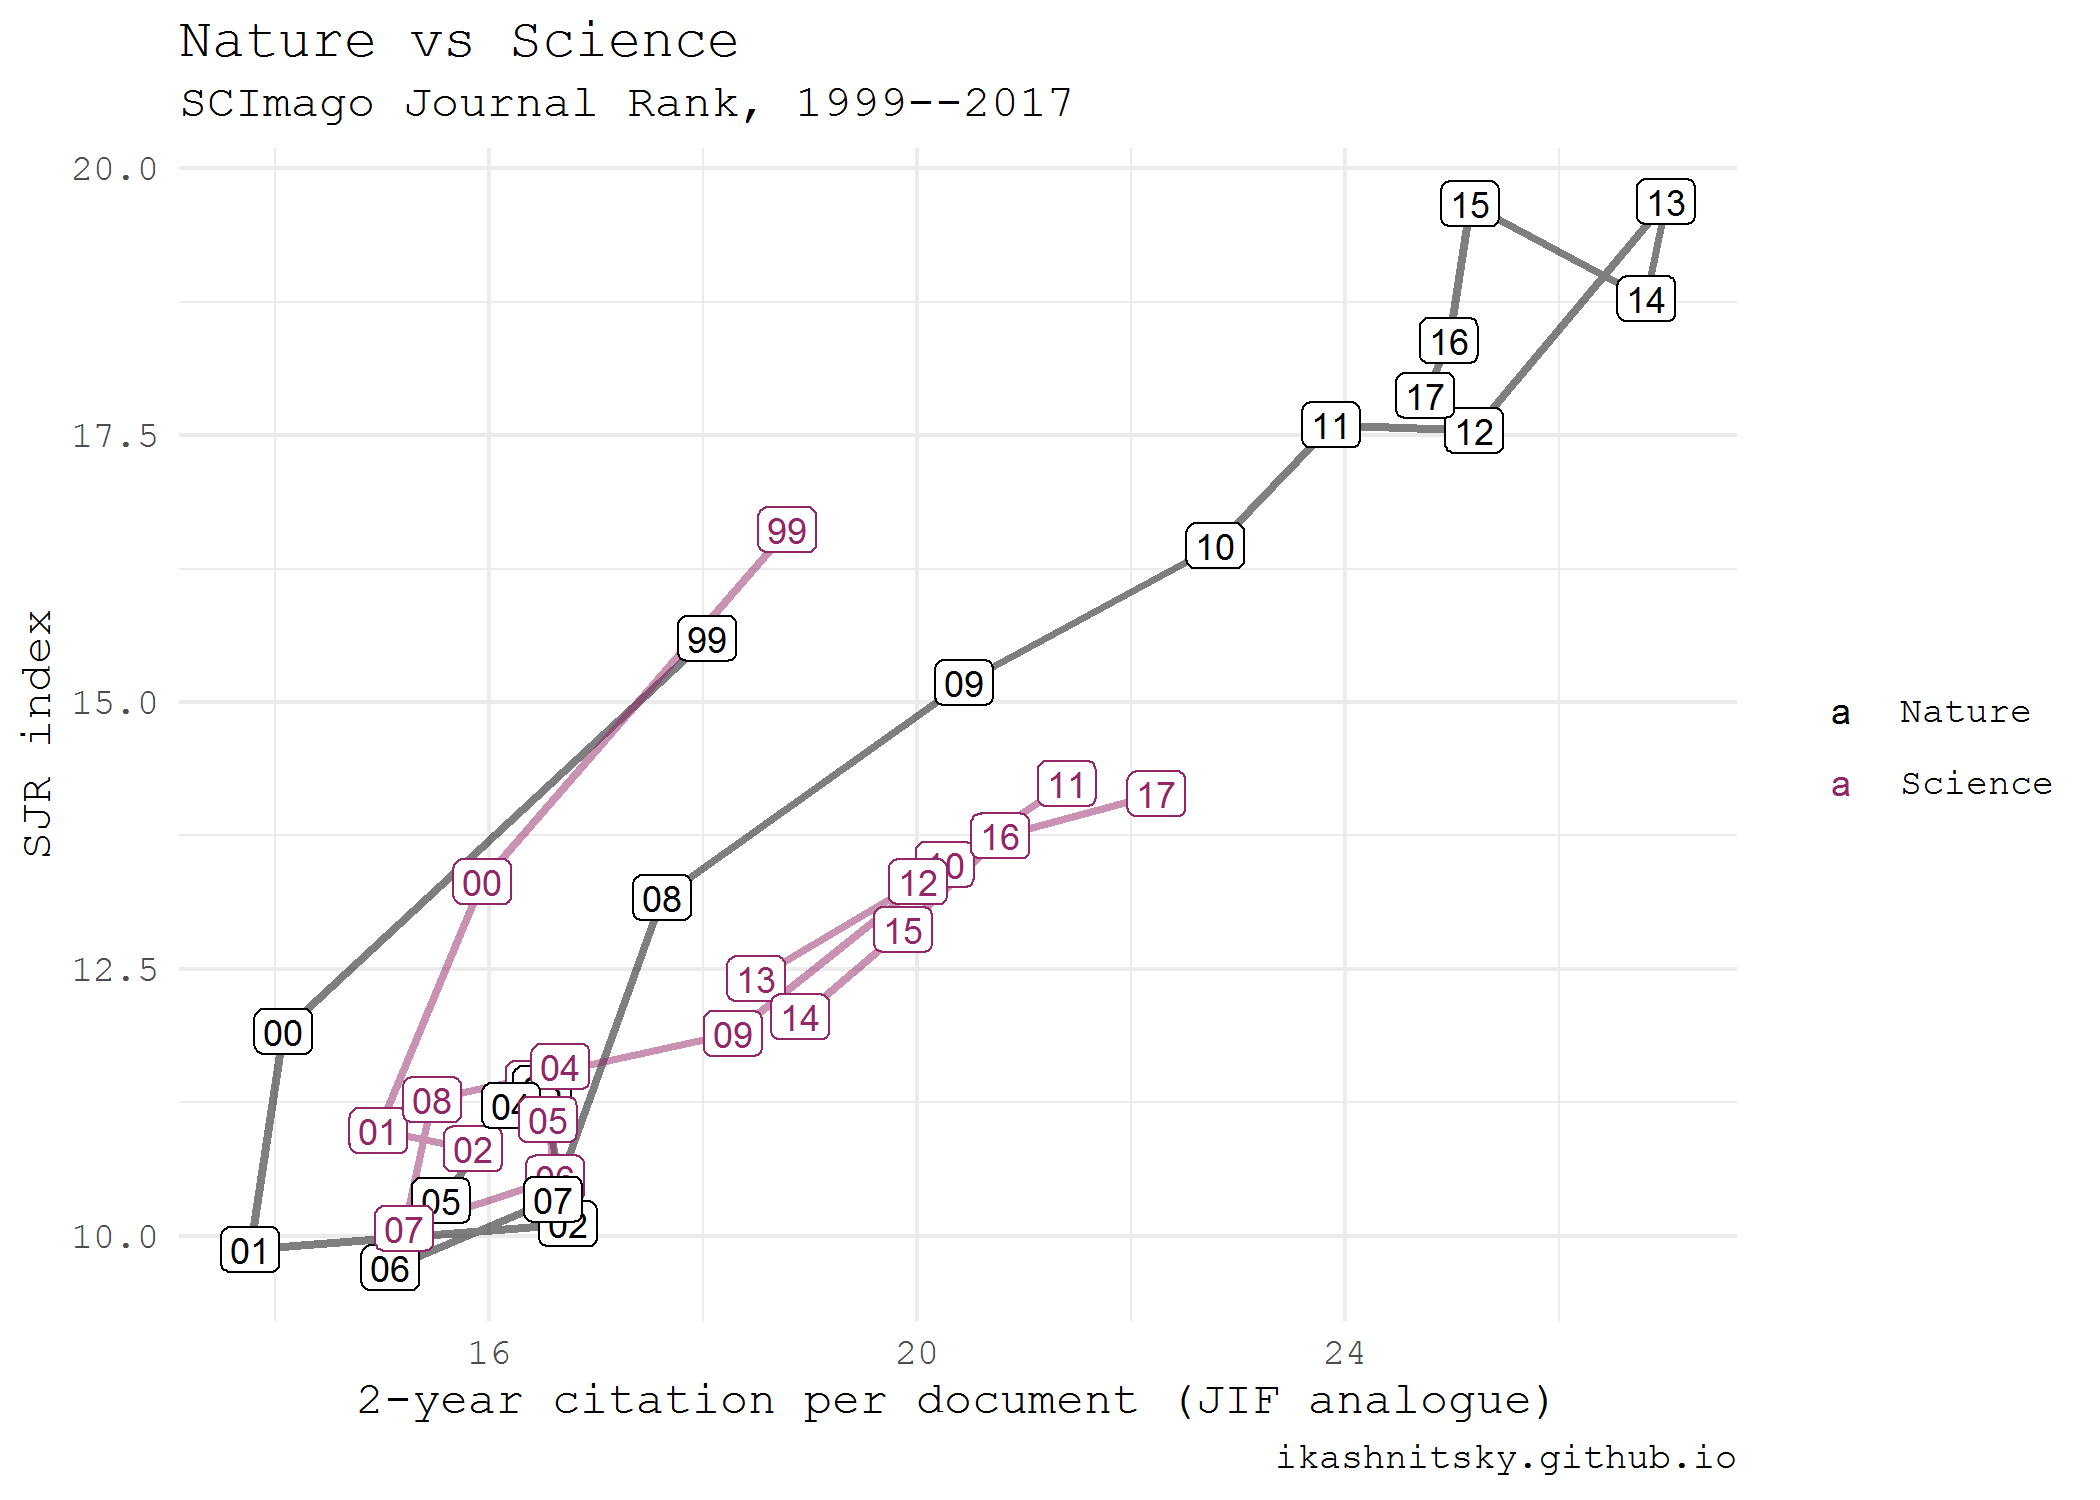
Let’s compare Nature and Science.

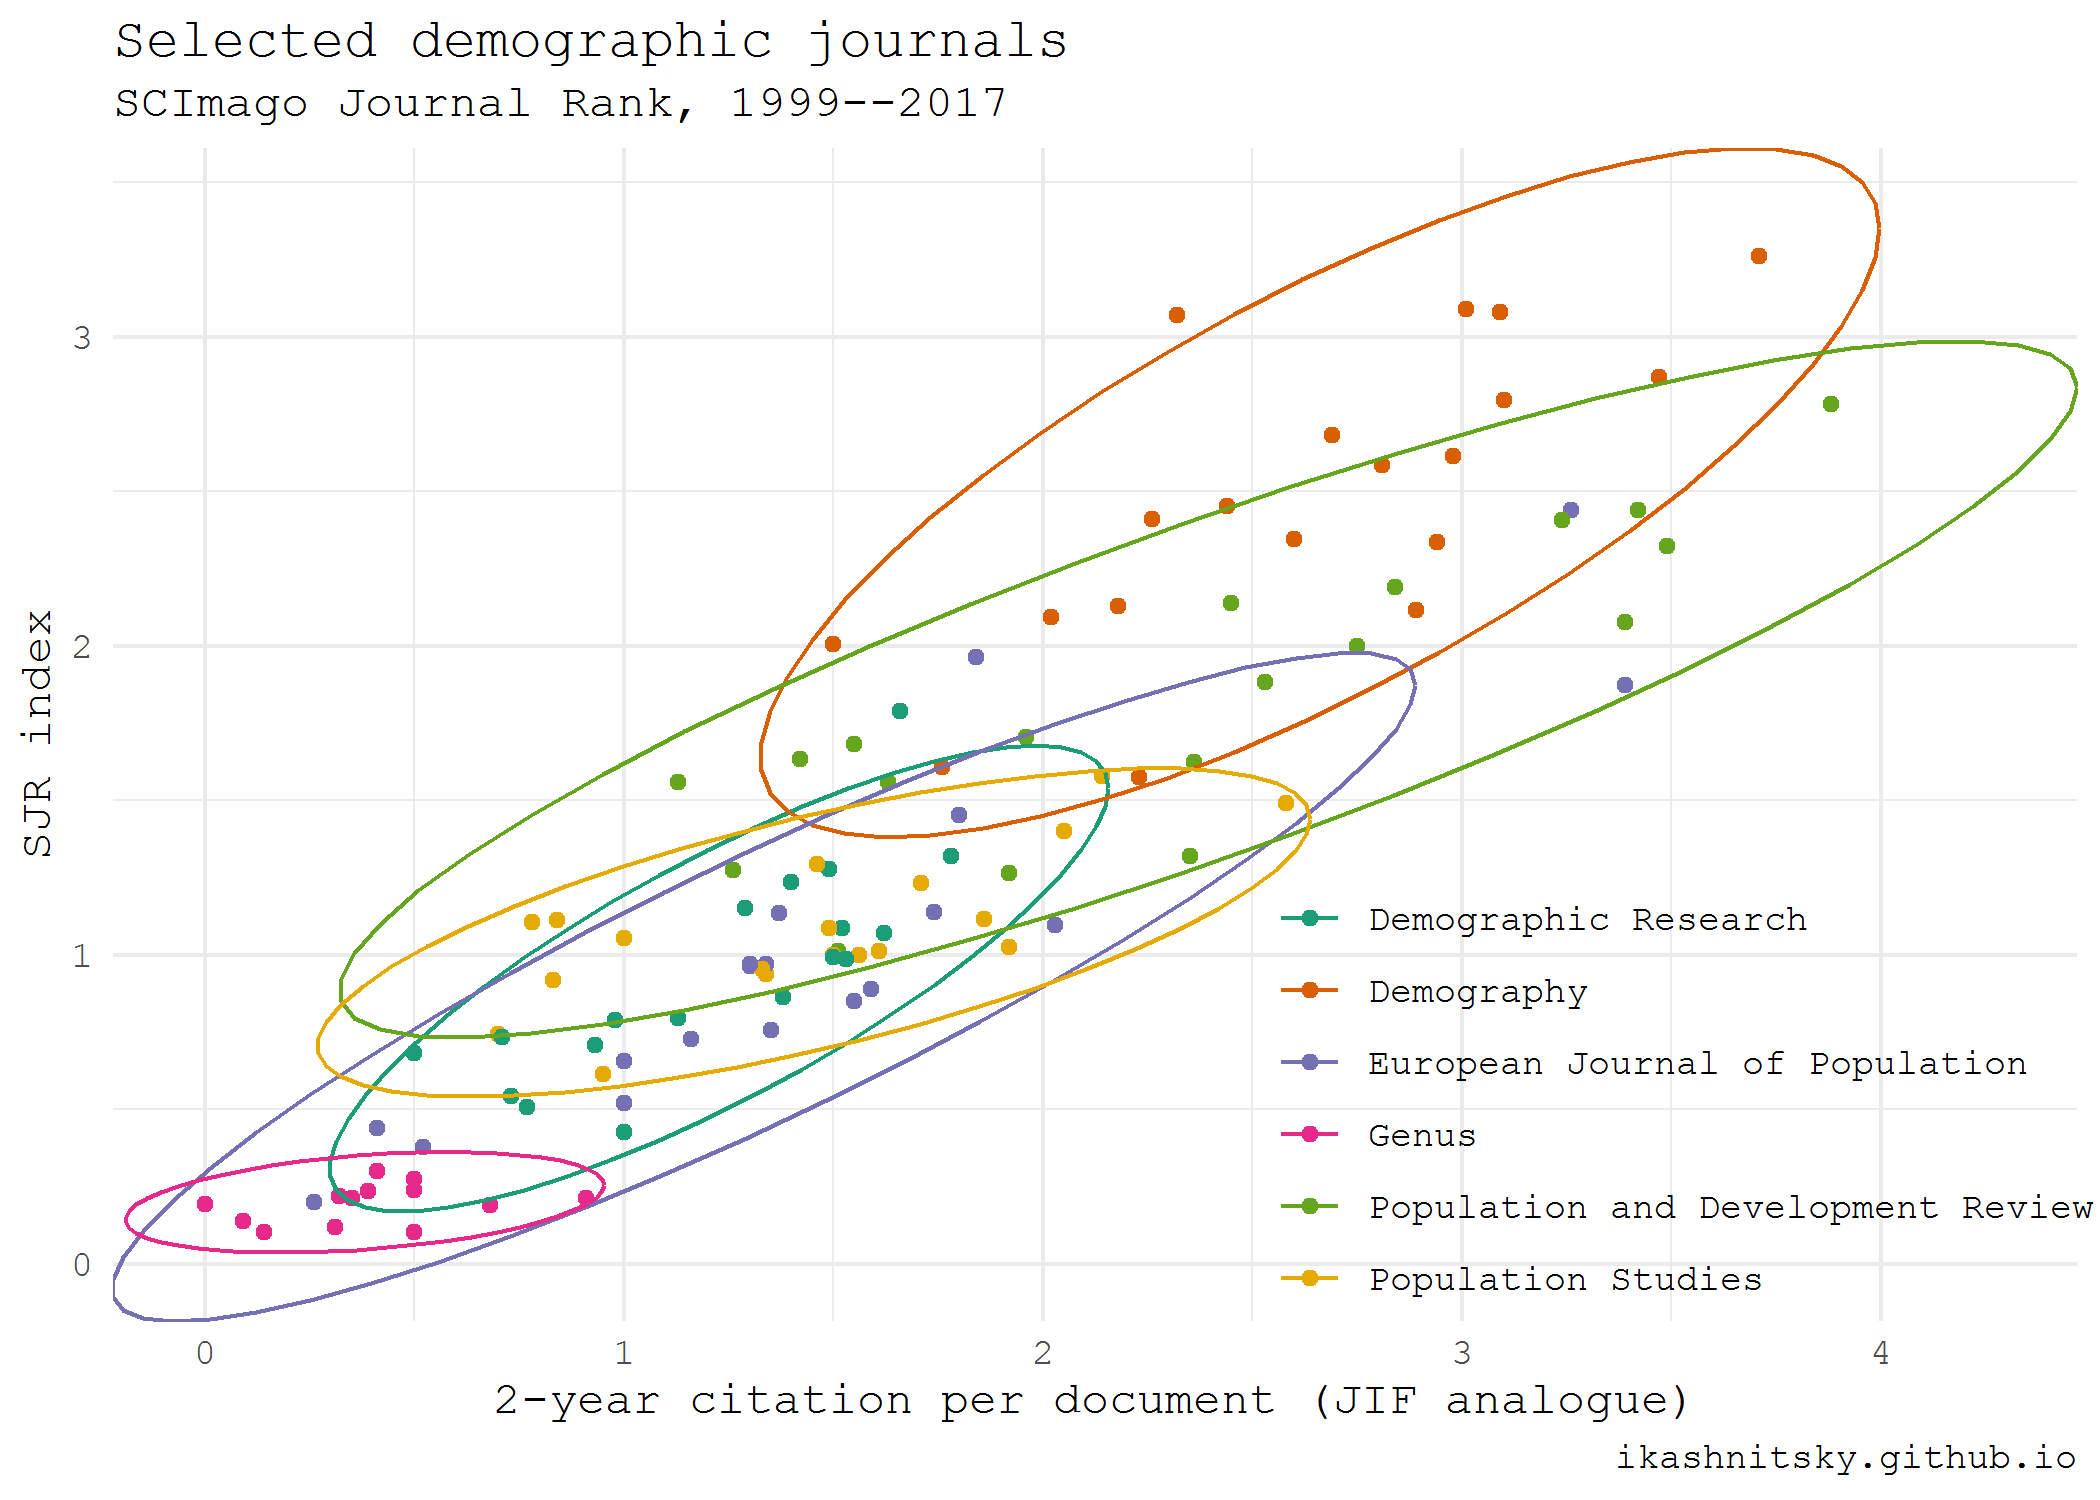
Several demographic journals.
sjr_journals |>
    filter(title %in% c(
        "Demography",
        "Population and Development Review",
        "European Journal of Population",
        "Population Studies",
        "Demographic Research",
        "Genus"
    )) |>
    ggplot(aes(cites_doc_2years, sjr, color = title))+
    geom_point()+
    stat_ellipse()+
    scale_color_brewer(palette = "Dark2")+
    coord_cartesian(expand = F)